Good
NATIONAL AVG.
2.09


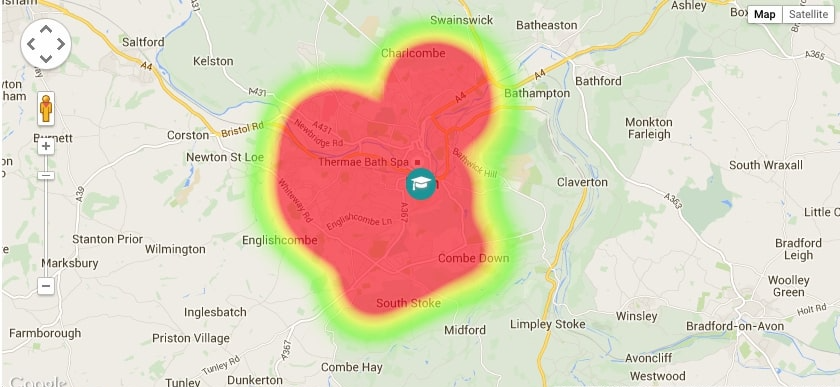

This pupil heat map shows where pupils currently attending the school live.
The concentration of pupils shows likelihood of admission based on distance criteria
This School Guide heat map has been plotted using official pupil data taken from the last School Census collected by the Department for Education. It is a visualisation of where pupils lived at the time of the annual School Census.
Our heat maps use groups of postcodes, not individual postcodes, and have naturally soft edges. All pupils are included in the mapping (i.e. children with siblings already at the school, high priority pupils and selective and/or religious admissions) but we may have removed statistical ‘outliers’ with more remote postcodes that do not reflect majority admissions.
For some schools, the heat map may be a useful indicator of the catchment area but our heat maps are not the same as catchment area maps. Catchment area maps, published by the school or local authority, are based on geographical admissions criteria and show actual cut-off distances and pre-defined catchment areas for a single admission year.
This information is provided as a guide only. The criteria in which schools use to allocate places in the event that they are oversubscribed can and do vary between schools and over time. These criteria can include distance from the school and sometimes specific catchment areas but can also include, amongst others, priority for siblings, children of a particular faith or specific feeder schools. Living in an area where children have previously attended a school does not guarantee admission to the school in future years. Always check with the school’s own admission authority for the current admission arrangements.
3 steps to help parents gather catchment information for a school:
School Description
This is smaller than the average-sized primary school. Most pupils are of White British heritage. The proportion of disabled pupils and those who have special educational needs supported through school action is above average. The proportion of pupils supported at school action plus or with a statement of special educational needs is below average. The proportion of pupils known to be eligible for the pupil premium is well below average. The pupil premium is additional funding for those pupils who are known to be eligible for free school meals and those children who are looked after by the local authority. Numbers in cohorts vary considerably from year to year. There are four classes. Children in Reception and some from Year 1 are taught as one class. The remaining pupils from Year 1 and those from Year 2 form another class. In Key Stage 2, pupils in Years 3 and 4 are taught as one class and those in Years 5 and 6 as another. A higher-than-average proportion of pupils join the school part way through their primary education. The school has had a number of staffing difficulties over several years. These have been caused by long-term absence owing to sickness and maternity leave.
 %
Parents Recommend This School
%
Parents Recommend This School
Responses taken from Ofsted Parent View
We are waiting for this school to upload information. Represent this school?
Register your details to add open days, photos and news.

Register to add photos, news and download your Certificate of Excellence 2025/26
*Official school administrator email addresses
(eg [email protected]). Details will be verified.
Questions? Email [email protected]
We're here to help your school to add information for parents.
A member of the School Guide team will verify your details within 2 working days and provide further detailed instructions for setting up your School Noticeboard.
For any questions please email [email protected]
24/7 Customer Service: [email protected]