2025 Secondary School data explained for parents

Posted by School Guide Blog Team to the School Guide Blog

In recent years, even school leaders have labelled the performance tables published the government "baffling".
The Department for Education has chosen to drop many 'old school' statistics from their headline measures (e.g. the percentage of pupils achieving 5 or more good GCSEs at each school) and place a greater emphasis on progress measures and new attainment criteria such as the English Baccalaureate. Read our blog ('Baffled by school league tables? School Guide is here to help') explaining the confusing nature of the changes.
But it's not all data doom and gloom.
The good news is:
1. We've created this straightforward Jargon Buster to help you navigate the 9-1 grade system and understand the latest progress measures and official tick boxes for attainment. It's written in plain English for parents.
2. School Guide continues to publish the relevant stats even though they are no longer displayed in government league tables. We know parents value them and they help parents make an informed and confident decision when it comes to choosing a school for their child. So, for example, we show an exclusive dial: 'Percentage of pupils gaining 5+ GCSEs from grades 4-9 including English and maths'. We also exclusively show what percentage of pupils gain three strong A levels (with results AAB) which parents find useful when judging a school's sixth form.

The 9-1 GCSE grading system explained
The old A*-G grading system is now replaced at GCSE with gradings from 9-1.
Under the new system, 1 is the lowest grade and 9 is the highest.
It's part of a drive by the Department for Education to raise academic standards and focus pupils on achieving higher grades. There is now a distinction between a 'standard pass' at grade 4 and 'strong pass' at grade 5, and one of the government's headline measures is the percentage of pupils gaining both English and maths GCSEs at Grade 5 (strong pass) or higher.
But a grade 4 is still a pass. It's a C in the old alphabetical grading system.
So far, so tricky to compare new numbers with old grades.
Furthermore, the new 9-1 numbers do not correspond evenly with the old A*-G system.
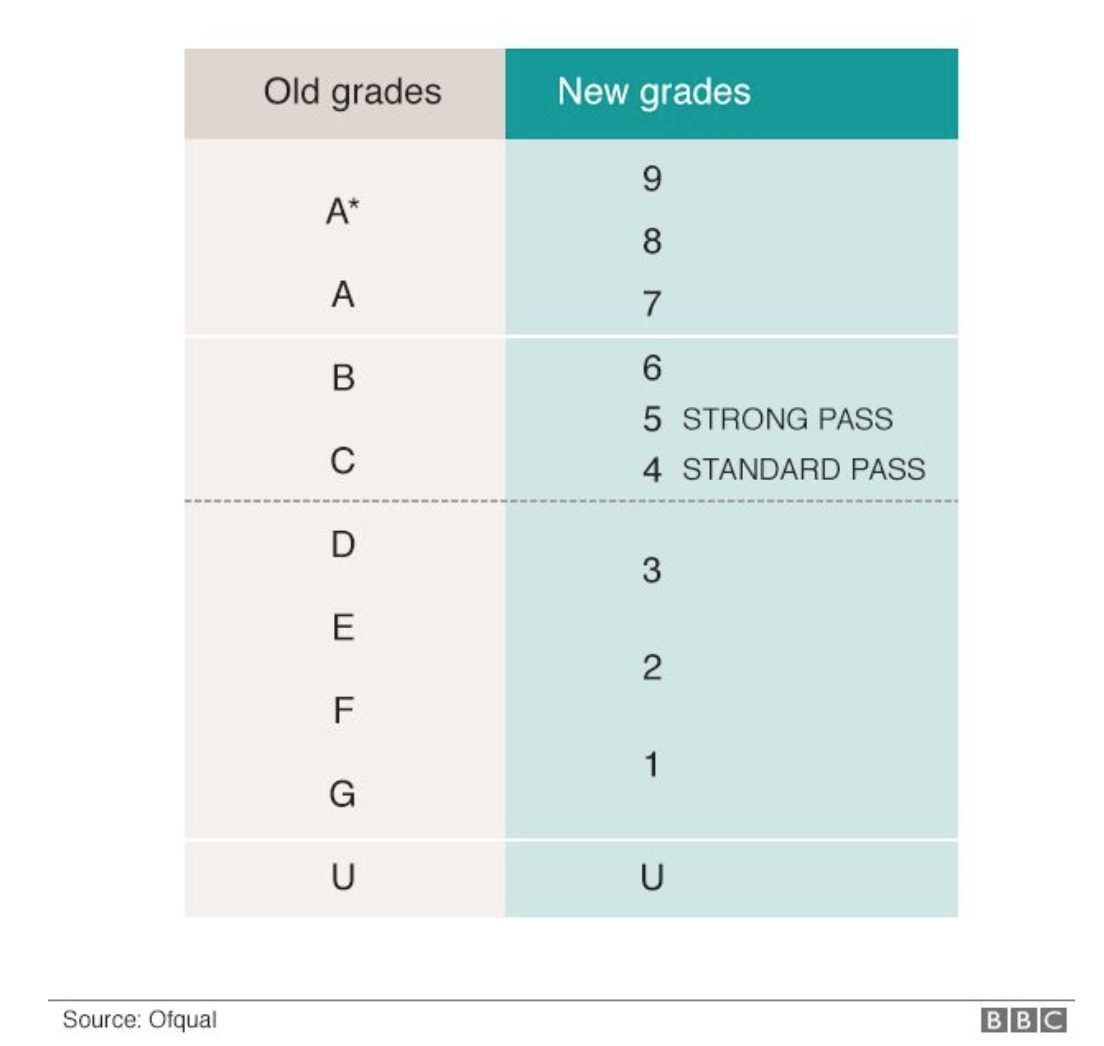
The BBC says the following and also offers a handy table:
"9 will be awarded to fewer pupils than A* was previously. In fact, three number grades, 9, 8 and 7, correspond to the current top grades of A* and A. This is designed to give more differentiation at the top end. A grade 6 is a bit higher than the old B grade.
Meanwhile, at the bottom, the new system has less detail, with grades D, E and F corresponding to grades 1 and 2, and the bottom of a grade 1 corresponding to the bottom of a grade G."
What is the difference between a standard pass and a strong pass at GCSE?
In the old A*-G system, the Department for Education considered a 'good pass' to be a C. In the new system, the government sets down 4 as a 'standard pass' and 5 as a 'strong pass'. This has caused some to brand grade 4 the "Poundland C" and grade 5 the "Waitrose C". They are both a C but one C is already a little less welcome at the GCSE party. The Times Educational Supplment says: "They may be numerical next-door neighbours, but in terms of social status, the numbers four and five have been drifting apart from each other for many years."
Understanding GCSE Progress 8 and Attainment 8
The Progress 8 score we show is the average of all pupils' individual Progress 8 scores, which takes into account their best eight GCSE results as well as the educational level at which they entered the school.
Since 2019, all subjects have been graded 1-9.
Each pupil's grades for their best eight GCSE results, including maths and English, are combined to produce an Attainment 8 score which is then compared with other pupils' scores to calculate their Progress 8 score.
Progress 8 was introduced by the government to give a more holistic view of how our children are progressing. Previously, at GCSE, schools were judged by the main headline measure: the percentage of children achieving 5 A*-C GCSEs including English and maths.
 This was considered to be unfair on schools who took in pupils with poorer grades at the end of primary school. So, for example, if a child entered Year 7 (the first year of secondary school) with a below average result in their primary school SATs, it would be considered good progress for them to achieve a grade 4 pass at GCSE. But this wouldn’t necessarily be reflected in the black and white exam results.
Progress 8 sets out how much progress pupils make as it measures like-for-like groups of children across England and gives a score based on whether they make more, about the same or less progress at this school. Results from the end of primary school SATs are compared with GCSE results and a score given around a zero national average baseline that, for most schools, ranges from +1 (good progress) to -1 (less progress).
On School Guide, we display more progress with an upwards arrow and less progress as a downwards arrow. It’s important to note that less progress is different to no progress.
The score is calculated by giving points to subject grades: some, like English and maths, are double weighted. The overall score includes points for up to eight approved qualifications, ‘approved’ being the key word here as the government has strict guidelines on what’s in and what’s out. These are: English, maths, 3 so-called English Baccalaureate qualifications including sciences, computer science, history, geography and languages, and 3 other additional approved qualifications including academic and vocational exams.
So, total points for the eight subjects are are divided by 10 (eight including English and maths that are double weighted) to get a per pupil result. The Department for Education website also offers a descriptive summary of how far above or below the national average each school sits. You can discover whether a school's progress is Well above average / Above average / Average / Below Average by searching here.

What A level data should I use to choose a school?
We exclusively show the 3 A levels AAB result, where available, which reflects the academic side to A level entry and our dial shows the % of pupils achieveing at least three levels at grades AAB or better including two facilitating subjects. This is a tough metric, and we do not show this dial if the school reports 0% pupils achieving this result.
‘Facilitating subjects’ are those most commonly needed for entry to leading universities. These are: biology, chemistry, physics, mathematics, further mathematics, geography, history, English literature and classical or modern languages.
Important note: this AAB percentage is no longer published as part of the official 16-18 performance data on the Find and Compare Schools website as, like the % of pupils achieving 5+ GCSEs, the government wants us to judge schools based on pupil progress not pure results. For A levels, this is the A level progress score i.e. the progress made from GSCE to A level.
We continue to take this key performance indicator from the official government dataset as it's useful for parents looking at A-level provision with a view to their child being accepted to a leading university.
If the dial is missing on the page of a school you are considering, please contact the school directly to ask about their A level results. The percentage of pupils achieving 3 A levels at C or higher will also be a useful guide to exam performance at A level and a good gateway higher education.
What does average A level as a grade mean?
This handy grade succinctly summarises the more complex average point system for A level and other academic post-16 qualifications including A levels, Pre-U and the International Baccalaureate. Points are assigned on a scale from E =10 to A* = 60 and these are added up and then divided by the total number of academic entries. It gives an average point score – the national average is 32.7 – and this is converted to a grade. C+ is the national average. Remember: there are a range of scores per grade so different schools with slightly different average points scores can both display the same average grade.
Understanding Secondary School reports
Secondary school reports are a vital tool that help parents track academic progress and overall performance. They often contain various sections, each designed to provide a comprehensive snapshot of the pupil’s achievements and areas for improvement. Many schools will now give two scores or grades per subject: one that reflects the level they are working at and one for effort. Some also add in a score for homework. The academic grade or mark will be given per subject. There will also be a teacher’s comment section where teachers may leave comments about the student’s attitude, behaviour, work habits, and participation in class. When reading reports, it’s important to understand the passing grade or expectation around accessing the next level of education such as university. Many school reports now also include information on attendance.

What is the School Guide Certificate of Excellence scheme?
We offer a free Certificate of Excellence to all schools, and this is updated every year with the latest data. This certificate includes their unique School Guide Star Rating, where awarded, and allows schools to show parents the results of all the hard work by pupils and staff.


