Baffled by school league tables? School Guide is here to help

It's no wonder many parents find official league tables harder to read than ever when one of the most senior school leaders in the country recently branded the new GSCE performance tables "potentially baffling".
Parents are "struggling to keep up" and most of us would need a Grade 9 in Computer Science (with a chunky module in Data Analysis) to understand how well a school is performing.
(Grade 9, by the way, is not an A* anymore but a bit better than an A*. It’s an A* from Waitrose. More on this in our Secondary Data Jargon Buster for Parents, which explores the numerical nuances of the new GCSE 9-1 grading system.)
Easy-to-read school data
Here at School Guide we work hard to try and make the data as easy as possible to read and continue to use a unique mix of measures to create our School Guide Star Ratings, whenever there is enough data for us to do so.
Our intention is that by using government headline progress measures combined with Ofsted data and exam results (even though these are little bit old school, according to the Department for Education), we can offer a 'does what it says on the tin' easy-to-read experience for parents. Stars range from 5 to 1 and give a simple summary of how well a school performed overall in the last academic year. Read more about how we calculate our unique School Guide Star Ratings on our About page.
So, we dive deep into the official data files and continue to publish performance measures that parents tell us are helpful. We show, for example, the percentage of pupils achieving 5 or more GCSEs A*-C or 9-4 including English and maths. The government removed this field from its performance data website and replaced it with the headline metric Progress 8, a measure they say is fairer to schools who start out with pupils at different levels. In Performance Tables Top Trumps, progress beats pure results.
Don’t get us wrong: Progress 8 is a really important measure and one that teachers themselves have long used (from back in the day when it was called a Value Added Score) for choosing schools for their own children. We also publish this and have even designed handy up and down arrows to express in an at-a-glance way if a school is, on average, progressing pupils more or less than others schools whose pupils started at a similar level.
But School Guide users tell us they also want to know how many good GCSEs and A levels pupils are getting. The number and quality of GSCEs will be important for going on to A level study and, likewise, the number and quality of A levels will be important for going on to higher education. Of course, the impact of a school’s success in progressing its pupils feeds into their black and white results. That’s why we show both sides of the performance coin and, along with Ofsted results, blend a unique mix of data with which we rate schools.
School Guide was built for parents
We hope our shiny new School Guide Star Ratings and friendly infographics help. Don’t forget we also have information uploaded by the schools themselves (schools can register for a free School Noticeboard here) our fantastic TripAdvisor-style parent reviews (register free with an email or via Facebook to upload your review here) and the not-so-small matter of being the home to the original Pupil Heat Map. Built with exclusive government data, our Pupil Heat Maps show where pupils currently attending the school live and are a helpful indicator of its catchment area when, like the performance data, school catchment maps can be baffling. Find these heat maps on each state school page and plot your postcode on the map to see where you need to live to get into the school.
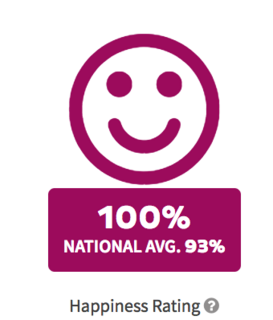
Finally, we'll leave you with an example of another bit of data that you will only find on School Guide: our Happiness Rating. We crunch fields together from Ofsted to offer parents the smileyest bit of school information on the world wide web:

More reading
• It was Geoff Barton, general secretary of the Association of School and College Leaders, who said the government had "once again moved the goalposts" with the secondary school performance tables and said the results were “potentially baffling”.
• For more information on the source of our official data, visit the Department for Education's 'Find and Compare Schools' website.
• Read our Secondary Data Jargon Buster for Parents. We’ve done all the homework to provide a straightforward breakdown of the new 9-1 “tougher” GCSEs and Plain English explanations of the official data on our secondary school pages.
• We also have a Primary Data Jargon Buster for Parents to go with the data on our primary school pages.


